Be wary of deep cyclicals, like traditional energy, when over-earning is a classic caution rightfully exhibited by investors, or at least those not in the momentum trading camp. The especially wide gap that currently exists between traditional energy’s market capitalization weighting in the S&P 500 and that implied by its earnings and profitability suggests investors are heeding that cautionary instinct and assuming some combination of commodity prices or bottom line earnings/cash flows/returns will prove unsustainable (Exhibit 1).
While we recognize the instinctual caution, we disagree that a collapse in profitability is imminent in the absence of a global recessionary environment. There is no change to our view that traditional energy is fundamentally under-appreciated and under-valued today. However, we are perhaps guilty of regularly stating or implying this without adequately reconciling our medium-term expectation of sustained, mid-teens-plus return on capital employed (ROCE) versus a long-term view that recognizes traditional energy in aggregate is undoubtedly a cost-of-capital business (i.e., a circa 10% ROCE sector).
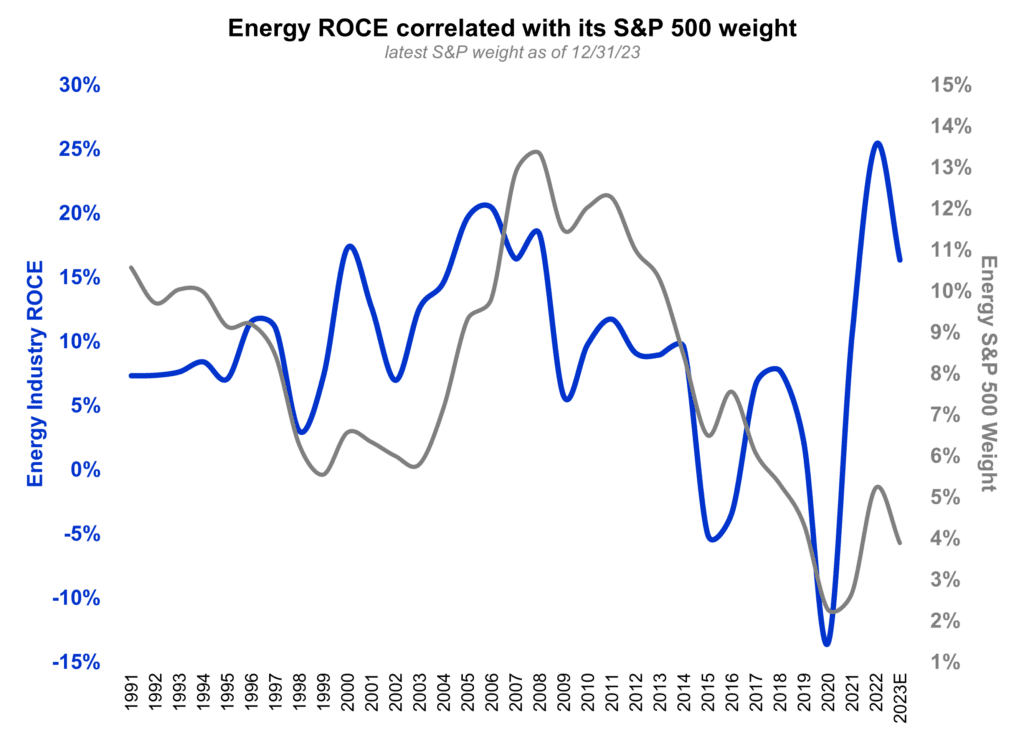
Exhibit 1: A wide gap exists between energy’s S&P weight and profitability
Source: Bloomberg, FactSet, Veriten.
The profitability cycle using our preferred ROCE metric has been a core feature of our work since starting Super-Spiked in November 2021. We refer readers to our ROCE Deep Dive series in late 2021 and early 2022 found here, here, and here. What we have not adequately done is tie the profitability cycle to our “normalized” profitability framework for evaluating the broad sector, various sub-sectors, and individual companies. It is a framework we initially learned and embraced as a buy-side equity analyst at J.P. Morgan Investment Management (JPMIM) in the mid-1990s. While we stopped using a JPMIM-styled dividend discount model (DDM) after moving to Goldman Sachs in 1999, the essence of that normalized profitability framework has always underpinned our world view.
How do we bridge the gap between energy’s discounted market capitalization with its robust earnings and profitability share?
- We agree that relative to a long-term “normalized” view of profitability, mid-teens-plus ROCE at the sector level will prove unsustainable.
- It is the medium-term cycle, which we define as the next 3-10 years, where we see the potential for profitability to remain above-normal coming off an extended period last decade of being below-normal. Classically, energy’s S&P weighting follows its medium-term profitability path as shown in Exhibit 1.
- We believe it was the especially sharp swing higher from the deep COVID trough in 2020, which itself came after a terrible decade for traditional energy, to a “best ever” near-term profitability peak post Russia-Ukraine in early 2022 that has driven excessive skepticism about what otherwise appear to be favorable medium-term prospects.
- Most importantly, for companies in the top two ROCE quartiles, we believe mid-teens-plus ROCE will prove sustainable over the long run. Throughout our career and to this day, our focus is on figuring out which companies are on-track to compound favorable ROCE over the long term, or, alternatively, have a strategy to maximize value recognition through an aggressive cash returned strategy or sale of company.
- For the top two profitability quartiles (across all sub-sectors), we believe compounding favorable ROCE will translate into valuations closer to broad market averages (at this time we are going to set aside for a future discussion the impact of the so-called Magnificent 7 market leaders—Apple, Nvida, et al.—on the magnitude of the S&P weight discount facing energy).
We would contrast our returns-based normalized approach with the short-term commodity price guessing game that is the obsession of many investors and Street analysts. For the short-term trader community, we appreciate it is relevant, and a small number of you excel in this sphere. For everyone else, we find near-term price-guessing to be way overemphasized. It is the profitability cycle and its drivers that are worth spending the bulk of one’s time evaluating.
Quadrilateral of Death reveals primacy of profits over pricing
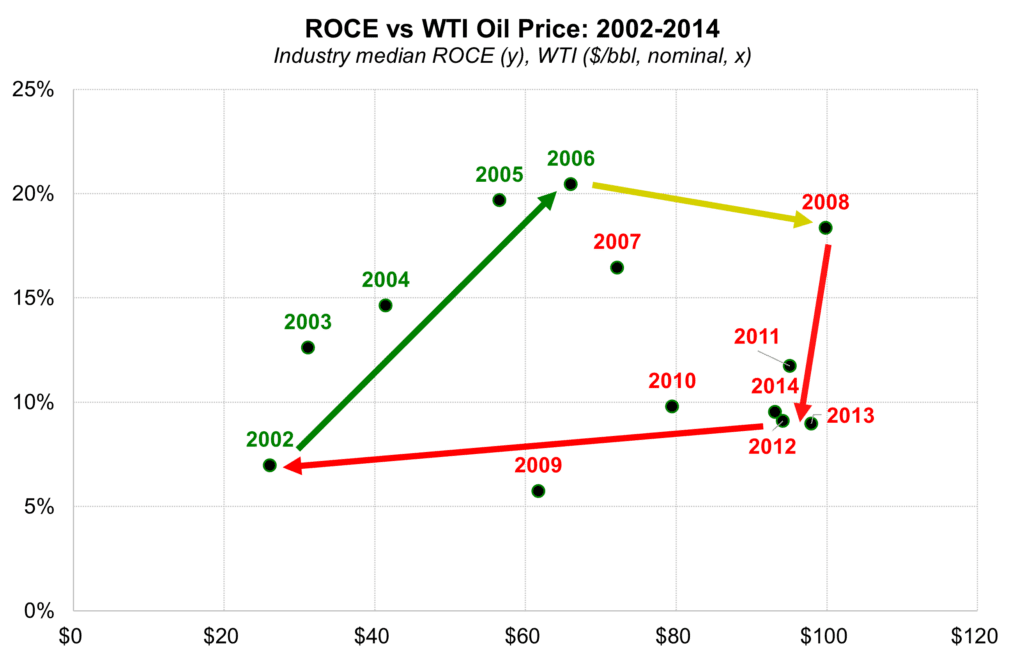
This may be our favorite and most relevant exhibit since creating Super-Spiked: The Quadrilateral of Death (Exhibit 2). It illustrates the fallacy of assuming commodity prices are the main driver of traditional energy profitability over the long run. We will keep this section brief as we have previously discussed these points (here):
- Over 2002-2006, oil prices and ROCE were positively correlated during the start of the Super-Spike (super-cycle) era.
- Over 2006-2008, oil prices rose another $35/bbl (not a small amount!) yet ROCE actually fell slightly—a clear warning sign that bad things were happening under the hood.
- Over 2010-2014, ROCE collapsed even as oil achieved every bullish analyst’s dream of sustained $100/bbl pricing.
- By the end of this period, ROCE at $100/bbl was no better than it was at $20/bbl a decade earlier. Remarkable.
What changed?
- CAPEX and cost inflation
- Legacy, lower-cost oilfields matured and newer, “greenfield” developments were higher cost
- Fiscal terms worsened in many key regions
- M&A occurred at valuations that required high oil or natural gas prices to persist
- Disappointing project execution occurred
The Quadrilateral of Death captures the interplay of commodity prices, costs, CAPEX, taxes, asset life, and changes to asset quality that is the key to understanding traditional energy. The “yellow” warning signal should not be ignored. Avoiding red has to be the goal of every company. Toggling between green and an occasional yellow is likely a realistic aspiration for industry leaders of all shapes and sizes.
Exhibit 2: Quadrilateral of Death
Source: FactSet, Super-Spiked.
The process is dynamic with slow-moving, long-term changes more important than short-term supply/demand dynamics
As we know, oil prices did not remain at $100/bbl+ and crashed over 2015-2019 to around $50/bbl. The low interest rate, “free money” backdrop fueled significant US shale oil growth that overwhelmed otherwise solid annual oil demand growth. But the biggest culprit, in our view, was the focus by most shale E&P management teams on the perceived profitability of individual shale wells and a near universal lack of appreciation for “total system” costs. This story is also well understood and we have discussed it many times before including here.
While we recognized there was a wide gap between well IRRs and total company profitability as expressed by ROCE at the time (we were not publishing publicly over 2015-2020 but did include analysis in various industry presentations we made), we were surprised at how long it took for both corporates and investors to turn off the unprofitable spending taps. In fact, it took the pain of the deep COVID trough to change industry hearts and minds to look more closely at total company profitability.
The point of this section is not to again beat-up on the mistakes of the past, but to recognize the primacy of the profitability cycle over simple commodity price dynamics when it comes to understanding the outlook for traditional energy. And to be fair, the 2015-2020 critique applies primarily to integrated oils and upstream exposed companies. Downstream players learned the profitability lesson two decades prior (in the 1990s) and have been on a sustained run of through-cycle excellence.
Our three-stage “normalized” framework
We view the terms “normalized,” “mid-cycle,” “sustainable,” “underlying,” “long term,” and “long run” as interchangeable for this exercise. We generally think about three time frames in sector, company, project, and M&A analysis: (1) near-term, which is the next 1-2 years; (2) the medium-term cycle over the next 3-10 years; and (3) the long-term, mid-cycle view for the period beyond 10 years. These time frames are meant to be indicative, not precise.
Analysis we did at Goldman Sachs showed that the greatest value and weighting accrue to long-term earnings/cash flow/profitability. Said another way, a “full” valuation is ascribed to the long-term mid-cycle view, with transient (i.e., interim) cash flows given discounted, cumulative “one-time” credit (positive or negative as the case may be). Regressions we ran in the early 2000s at Goldman suggested that relative to “100%” credit for mid-cycle value, companies received around 30 cents on the dollar of credit for transient cash flows. We have not (yet) tried to replicate that work, but suspect the orders of magnitude will still hold.
The medium term can be the trickiest period for an investor or corporate in that if an up- or down-cycle still has say 5-7 years to run, it might eventually receive greater weighting from investors or companies than what may ultimately prove appropriate from a truly long-term view. We surmise that the biggest mistakes are made in assessing the medium term. There is a temptation to spend in the later stages of an up-cycle or exhibit excessive caution toward the end of weaker periods (or even after a turn higher).
The near-term view (1-2 years) is usually most difficult to accurately assess given that small changes to supply/demand balances and the impact of weather, geopolitics and other exogenous events can lead to sharp swings in headline commodity prices and margins. With that said, most of the Street spends an inordinate amount of time forecasting the near-term.
The long-term view is often insufficiently differentiated from the medium-term; in other words, the assumption that good or bad times will last “forever” often and incorrectly becomes the prevailing wisdom.
Long-term view: Traditional energy in aggregate is a cost-of-capital business
Through all the ups and downs, good times and bad, super-cycles and super-busts, our view of the ultimate long-term profitability for the traditional sector as a whole has never changed much: it is a cost-of-capital sector. If we stick with the oil business (upstream + midstream + downstream) as an example, one would expect excess returns, positive or negative, to eventually get competed away. If profitability is too good for too long, it invites excessive capital spending that ultimately leads to oversupply and weaker returns. The opposite also holds. It usually takes an extended period of above-normal profits to motivate needed, long-cycle capital spending and vice versa.
A big difference between traditional energy and many other cyclical sectors is that lead times are long and oil and gas fields deplete over time. In the upstream business, the time to study a new hydrocarbon basin, sign a lease with a host government or landowner, shoot seismic, drill an exploration well, drill delineation wells, sanction a project, invest in full field development, and ultimately achieve start-up is usually measured in no less than 10 years and potentially much longer. To be sure, companies are continuously doing a mixture of all of these activities, so it doesn’t always appear that producing oil or natural gas is decades in the making. Depletion means returns ultimately have to get to levels that motivate new CAPEX in order to sustain or grow supply. Depletion is therefore a double-edged sword for upstream companies. It guarantees capacity reductions will occur with enough time and motivates a long enough upcycle to ensure adequate supply to meet demand. On the other hand, it requires going concerns to continuously figure out what’s next and to spend risk capital over time.
What is most noteworthy today, in our view, is that despite much-improved profitability for the past two years, there still exists a general pessimism on the part of investors and therefore corporates toward the long-term prospects of the oil and gas industry (Exhibit 3). We know the reasons: (1) many believe some notion of peak demand is within sight; and (2) everyone remembers the bad ole days of last decade. But we have had deep downcycles before and at least in my career (32 years and counting!), there has always been an interest in figuring out “what’s next?” That curiosity, as a general comment, is broadly lacking in traditional energy. New ideas are needed.
Exhibit 3: CAPEX still remains closer to trough levels and well below the “danger zone”
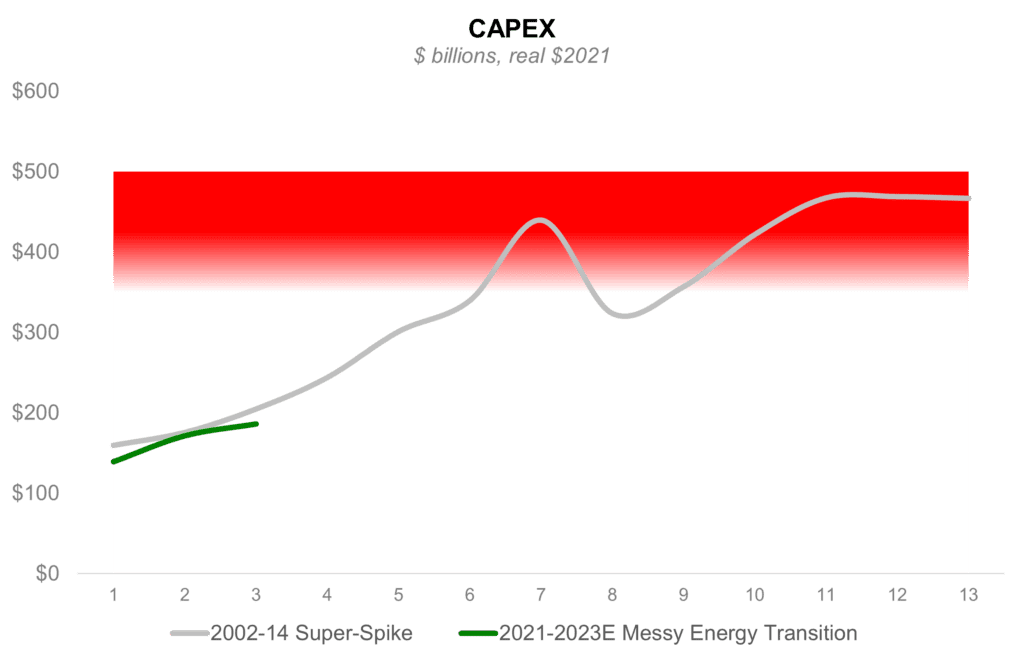
Source: FactSet, Veriten.
Medium-term view: Up or down cycles are 10-15 years in duration
The long lead time nature of energy results in extended periods of “good” or “bad” profitability that are correspondingly above or below cost-of-capital for an extended period of time: 10-15 years up, 10-15 years down. The medium-term cycle is highly relevant to how investors view the industry, which we can see in that broad tracking of the industry’s earnings and profitability with its market capitalization.
In the last cycle, industry profitability actually peaked in 2006 and broadly declined to its COVID trough in 2020. We believe we are now in year three of what we think will be a decade-plus period of “above normal” profitability.
Short-term view: Your guess is as good as mine
Just about all Street analysts and a large portion of the investor base spend lots of time evaluating (guessing?) the short-term direction of commodity prices. It is what it is; it has never been something we found very appealing beyond having to have a short-term forecast for publication purposes at Goldman.
We have characterized our short-term view as “Super Vol” rather than super-cycle. Despite at times being tempted to transition to the more optimistic super-cycle language, we have simply not gotten over the hurdle of believing that structural demand growth is sufficiently higher than remaining low-cost US shale oil growth, which has been supplemented by new production from Guyana and Brazil in particular. It is our expectation that in the absence of a more significant CAPEX cycle, we will in coming years transition to super-cycle from Super Vol, given our favorable outlook for oil demand growth. We consider that to be a “when” not “if” question.
Companies versus the sector
When we talk about the broad sector ultimately reverting to a long-term return on capital that approximates cost of capital, this is not necessarily true for individual companies. The classic examples include the legacy Super Majors like ExxonMobil, Chevron, and Shell (and their predecessor versions) which have generally earned well in excess of cost of capital over a century-plus. The opposite is also true. The sector has observed companies that are perpetual capital destroyers that, somehow, at least in prior cycles, were able to attract new investors who either had an optimistic view of commodity prices or bought into the company’s latest business improvement plan.
Our definition of a company that deserves “going concern” valuation is one that has demonstrated it can sustainably earn in excess of its cost of capital and has a management team, asset base, forward-looking strategy, and balance sheet capable of sustaining excess returns over the long run. Over the past 30 years, with the notable exception of the 2015-2020 period, the top two quartiles have generated double-digit ROCE on a sustained basis (Exhibit 4). Traditionally, it was the integrated oils, especially the largest ones, which attained “going concern” recognition by investors. We believe today there are companies in most of the key sub-sectors that have the potential to achieve going concern status.
Exhibit 4: Top two ROCE quartiles are the place to be
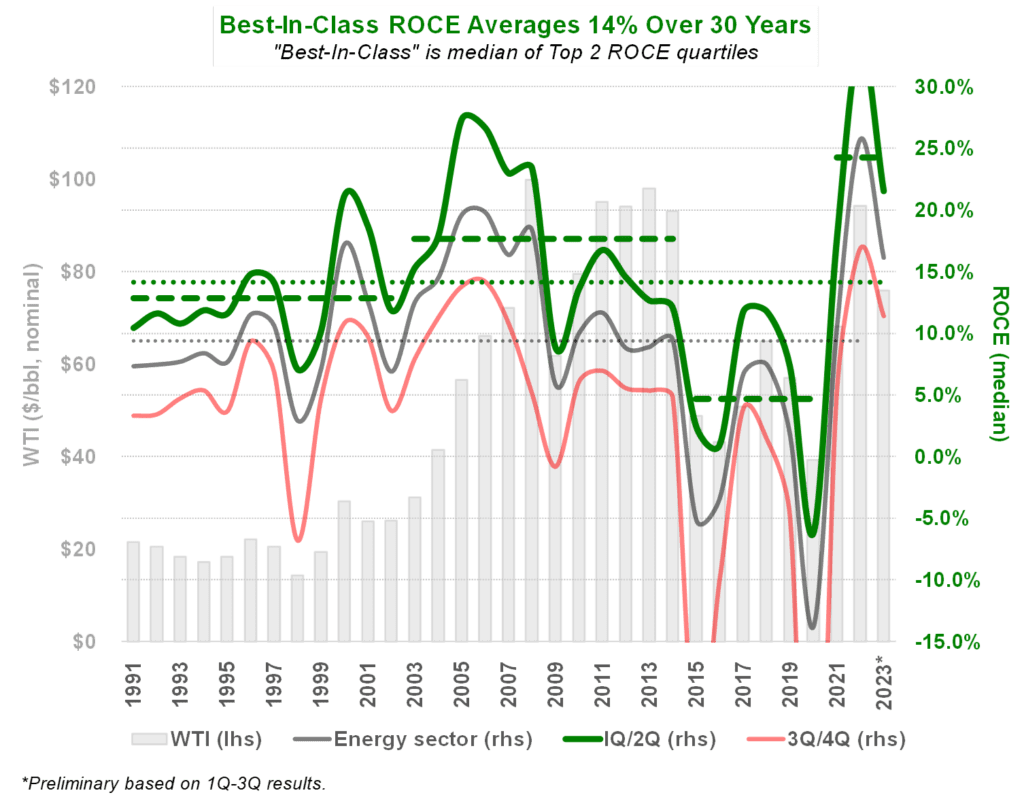
Source: FactSet, Veriten.
Caveats and clarifications about profitability metrics
ROCE is our preferred profitability metric, but no single metric should be considered the be all and end of all of sector analysis. That said, for capital intensive, cyclical, volatile energy sectors like E&P and downstream, we prefer an unlevered, total company profitability metric like ROCE as a preferred evaluation tool.
ROCE, like any metric, is but one measure within a broader mosaic of considerations. Like any metric, it can be manipulated and at times send incorrect signals. There are always trade-offs to consider. An example with ROCE is that there are times when a near-term ROCE-dilutive acquisition or project can make sense if it allows for advantaged ROCE to extend into a future period.
An ROCE analysis does not always make sense for individual projects. The use of internal rate of return (IRR), net present value (NPV), and similar metrics are useful. The key, though, is to recognize the trade-offs inherent in those calculations. For example, an oil sands or LNG project that generates a 12% IRR with flat production and minimal maintenance capital over 30 years might be the far better use of capital than a shale drilling program that yields 30%+ IRRs on individual wells (inclusive of midstream and other required costs to take production ultimately to a refinery for processing), but where asset life is measured in a handful of years. Industry has made many mistakes prioritizing seemingly high IRR short-lived assets over lower IRR but long-lived assets. IRR-based investment projects ultimately will need to translate into acceptable corporate-level profitability on a metric like ROCE.
For NPV, many companies seem to use a theoretical cost-of-capital of 8%-10% for the hurdle rate. That is at odds with the type of profitability investors demand to award a company a premium, going concern valuation. We believe the starting point to have a chance to reach “going concern” valuation status is a 12% ROCE and preferably mid-teens. Investing in 8%-10% NPV projects, especially if based on strip or perceived “mid-cycle” prices, we believe will prove disappointing.
⚡️ On a Personal Note: JPMIM
I spend a lot of time talking about my Goldman Sachs years and have shown appreciation for my start at Petrie Parkman & Co. in 1992. I have spent far less time on career stop #2. I can still remember standing in the 45th (+/-) floor lobby of Neuberger Berman in 1994 with my original mentor and boss Paul Leibman (at Petrie) against the backdrop of that great panoramic view of New York City and thinking (maybe I stated) some day I am going to permanently come back to New York City, which we all know is the center of the world.
When JPMIM came calling in 1995, I jumped on the chance. Some 29 years later, I am finally starting to miss Colorado, but we will leave future plans for another day (empty nester rent versus buy feedback is welcomed). I was originally hired by JPMIM to lead our small-cap energy research effort and support Chris Corapi, the large-cap energy analyst. When Chris made a career change, I was given the opportunity to cover the full sector. In those days, JPMIM primarily focused on defined benefits (DB) pension funds, which was the norm in decades past prior to the self-directed 401-K and defined contribution (DC) boom that is now how retirement funding works. I would guess that the DB focus motivated the longer-term approach to investing JPMIM exhibited.
Those four years at JPMIM had a profound impact on how I viewed the energy sector that persists to this day. The firm focused on “normalized” earnings/returns for years 3+, which was just beyond the 1-2 year time horizon where most of the Street spent all its time. The basic idea was to figure out when a sector or company was over- or under-earning relative to mid-cycle and invest accordingly. The entirety of this post is in essence my application and interpretation of that philosophy.
In each of my first three career stops, I was blessed with an exceptional mentor/boss. Paul Leibman at Petrie, Chris Corapi at JPMIM, and Steve Strongin at Goldman Sachs. When I was at JPMIM, we were offered lunch for free in its cafeteria. Literally the entire research department, or whomever was not traveling, would informally grab lunch together. It was a high-performing, collaborative, and friendly culture. Aside from the good memories, that career stop still defines how I analyze the sector to this day.
📖 Weekend Reading: Oil Man
I aim to read about 25 books per calendar year or just over two a month. I find reading books are a nice and needed change of pace to the slew of Street research, Substack subscriptions, Twitter-X posts, Babylon Bee newsletters, and other short-form content imbibed via firehose. As a compliment to the surprisingly popular On A Personal Note section, we are going to see how an occasional Weekend Reading paragraph or two goes.
Several years ago a former Warburg Pincus colleague gave me his copy of Oil Man: The Story of Frank Phillips and the Birth of Phillips Petroleum by Michael Wallis originally published in 1988. I will admit my desire to recently read it came from watching the great Killers of the Flower Moon movie about 1920s era killings of Osage Nation members after the discovery of oil on their land. Section two of this book is about Frank Phillips’ history with The Osage. Per Mr. Wallis’ account, Mr. Phillips had a great relationship with The Osage, which I was happy to read. I have come to learn that The Osage are the most financially successful Native American tribe in America; I’d be curious to know how or why that came to be.
I especially enjoyed learning that Frank Phillips was originally a banker (!!!), and a successful one, before turning to the oil industry. Given my affiliation with a successor company, I will leave it to others to weigh in on whether or not an ethos of financial discipline began with one of its founding fathers.
If you like American history, are currently intrigued with the late 1800s/early 1900s era, enjoy business biographies, are fascinated by The Osage, and recognize the need to remember how critical the oil and gas industry has been and remains to America’s success, I recommend this book.