
This week we dive deeper into cash return on gross capital invested (CROCI), a “cash-on-cash” corporate profitability metric that we see as an excellent complement to our long-standing use of return on capital employed (ROCE). CROCI addresses several of the main criticisms many investors have with ROCE:
- CROCI is a “cash flow”-based metric in contrast to ROCE, which is a “book accounting”-based calculation.
- CROCI does not “forgive” write-offs as go-forward ROCE does, which has the effect of artificially boosting future ROCE for companies that took large impairments.
- ROCE runs the risk of incentivizing current management teams to “leave the cupboard bare” for the next generation, as it can at times be too punitive to reasonable risk taking and necessary long-term capital investments. CROCI is not immune from this issue, but moderates the near-term impact of spending (which we recognize can be a dual-edged sword).
Our big picture conclusions about traditional energy are unchanged via the addition of a second corporate returns metric.
- We believe 2024 will prove to be year four of what we expect to be a 10–15-year profitability super-cycle for traditional energy.
- When we look at the peak and trough of prior cycles, such as the 2002-2014 Super-Spike era and the 2015-2020 Super-Spike bust period, the use of CROCI does not change our big picture conclusions.
- The “quadrilateral of death,” which we use to explain the impact of capital spending on sector profitability, looks identical under CROCI versus ROCE.
Where we start seeing interesting differences in using CROCI versus ROCE is at the sub-sector and individual company level.
- Because CROCI effectively excludes accounting write-offs and impairments, it has a moderating effect on peak, trough, and average historic returns.
- Counter-intuitively, companies/sub-sectors that have taken large write-offs actually look better on historic (i.e., backwards-looking) CROCI; the balancing item is that go-forward return metrics are not boosted by legacy write downs.
- When looking at 2001-2023 average ROCE versus CROCI, we observe less differentiation among various sub-sectors using CROCI versus ROCE. The downstream sector showed the most improvement over the past 20 years and this is consistent using both ROCE and CROCI, where it now leads.
- The international oil companies (IOCs) are the only sub-sector where historic ROCE is higher than historic CROCI.
- At the company-specific level, the impact on ROCE versus CROCI is especially pronounced, given the large write-downs taken in 2020 and 2016.
- Unsurprisingly, there are a number of companies with artificially boosted ROCE that look much worse on CROCI on both an absolute basis and versus peers. However, there are other companies that also are enjoying an artificial ROCE boost but have actually improved CROCI versus peers. While Super-Spiked does not delve into company-specific analysis, we believe management teams, boards, and investors should take time to understand these nuances, which is why we mention it.
We will need help on identifying the lead author from veteran Goldman Sachs personnel from the 1990s (before our time), but there was a great valuation report called All Roads Lead To Rome. We agree; we do not believe any singular metric should be considered the be-all, end-all valuation metric. Neither ROCE nor CROCI nor anything else is the equivalent of a religious cause. It is all part of a mosaic to understand company and sector value creation/destruction.
CROCI definitions and clarifications
Origin story: As we noted in last week’s brief introduction to CROCI (here), we credit the great Credit Suisse First Boston equity analyst team from the 1990s led by Jim Clark and Gordon Hall for the initial creation and commercialization of this metric. They called it return on gross capital invested (ROGIC). When we joined Goldman Sachs in 1999 from the buy-side, the new European Oils analyst team led by Anthony Ling was using a similar metric that they called CROCI. We have always been much more in the ROCE camp, but Ling and team in Europe and Brian Singer who covered US E&Ps were CROCI proponents. We are using the CROCI branding at Veriten and with Super-Spiked.
ROCE definition: Return on capital employed is a “book on book” returns calculation. We calculate it using reported net income plus after-tax net interest expense in the numerator divided by net debt (total debt less cash) plus shareholders equity using an average of the prior and current year for the denominator.
CROCI definition: CROCI is a “cash on cash” returns metric. For the numerator, we use reported cash flow operations (from the cash flow statement) plus after-tax interest expense for the numerator. For the denominator we use net operating working capital (i.e., excluding cash and equivalents and short-term debt) plus gross PP&E plus goodwill plus other assets; we use an average of the current and prior year. In essence, this grosses up shareholders equity in the ROCE denominator for accumulated DD&A (and a few other items) which has been historically deducted to arrive at net income.
Net versus gross debt: For both ROCE and CROCI, we prefer using net debt (total debt less cash and equivalents). Some analysts prefer to use gross debt and treat cash as invested capital in both calculations. We believe both methods are reasonable and it is a matter of personal preference. Philosophically we believe there is no such thing as having “too much cash” and we do not believe company profitability metrics should be penalized for holding cash. There is in fact considerable strategic value in a volatile, cyclical business like traditional energy to having a fortress balance sheet and significant cash on hand. We recognize not everyone shares that view.
Why not simply adjust ROCE for write-offs as some (claim to) do? When covering a narrow universe like the US integrated oils and refiners, it was quite possible to stick with ROCE and make necessary company-specific adjustments for write-offs, pooling versus purchase accounting (discussed here), and other issues. As the universe becomes larger, and as we are now including many companies that are long gone as publicly traded entities due to merger and acquisition (M&A) activity, going back and consistently making adjustments we think is a challenge. We also believe this is even more challenging if an attempt is made to compare energy to other market sectors. We would also observe that while it is certainly possible to add back the last 5 or 10 (or longer) years of impairments, it is much harder to adjust net income for the higher DD&A that would also be necessary to properly adjust ROCE on a “write-offs”-adjusted basis. For those that purport to be using write-offs-adjusted ROCE, we would be interested to hear how they are handling DD&A in net income calculations.
Cash flow from operations is still an accounting metric: Regarding the idea that ROCE is “book” and CROCI is “cash,” we should be clear that all metrics for publicly-traded companies reflect “accounting” in that they are based on SEC documents like a Form 10-K. Still, we are comfortable characterizing ROCE as book and CROCI as cash based.
Cash-on-book is not a thing: The biggest mistake we have seen some companies (mostly E&Ps) make is incorrectly using cash flow from operations in the numerator divided by the capital employed used in ROCE as the denominator. This is effectively cash-on-book, which does not make analytical sense. Please do not do this! In other words, CROCI is NOT cash ROCE as some, we believe mistakenly, have done.
ROCE vs CROCI: At sector level, similar trends, but different amplitudes
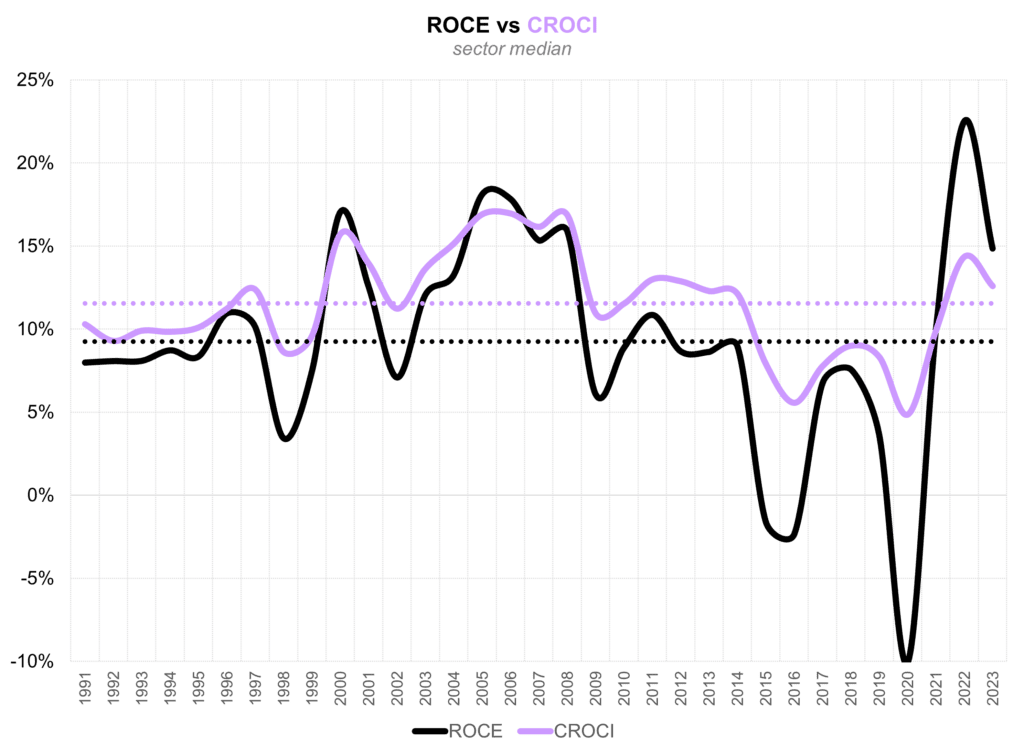
At the overall sector level, there are not meaningful differences between ROCE and CROCI in terms of how the last 30 years have played out (Exhibit 1). Primarily the peak-to-trough amplitude is much wider under ROCE given write-offs and impairments. A few highlights looking at the last cycle:
- The overall cycle trends are the same using both return measures.
- On both metrics, returns improved from the 1990s to a 2006-2008 peak and then structurally eroded from 2008 until 2020.
- ROCE peaked at 18% in 2006 and troughed at -10% in 2020, a 28% peak-to-trough spread.
- CROCI peaked at 17% in 2006 (and 2008) and troughed at 5% in 2020, an 11% peak-to-trough spread.
- Notably, ROCE gave the better signal that underlying fundamentals had weakened considerably over 2011-2014 when WTI oil was still trading around $100/bbl.
- It’s a judgement call but the mid-single digit CROCI likely better represents profitability over 2015-2020 rather than the zero-to-negative ROCE experienced using reported earnings. Notably, while earnings went significantly negatively in 2020, cash flow from operations and hence CROCI, while weak, was still a positive number.
- On both metrics, a new upcycle began in 2021, with a near-term peak in 2022, and an easing in profitability in 2023 using both metrics. However, CROCI did not reach an all-time high in 2022 as did ROCE.
Exhibit 1: Energy sector ROCE versus CROCI
Source: FactSet, Veriten.
We have used the “quadrilateral of death” to explain the cycle of returns vis-à-vis the capital spending (CAPEX) cycle. As a reminder, the basic idea is that from 2002-2006, oil prices tripled from around $20/bbl to about $60/bbl and sector profitability improved in lock step (the green line). By 2008, the significant ramp in CAPEX was starting to negatively impact returns as a further $35/bbl increase in WTI oil prices did NOT translate into higher profitability (the yellow line). Returns then collapsed by 2012-14 such that profitability was not very different at $100/bbl WTI than it was pre-super-cycle at $20/bbl (the red lines)! The point here is that the picture looks the same using CROCI or ROCE, with just the smaller peak-to-trough spread using the former (Exhibits 2 and 3).
Exhibit 2: Quadrilateral of Death using CROCI
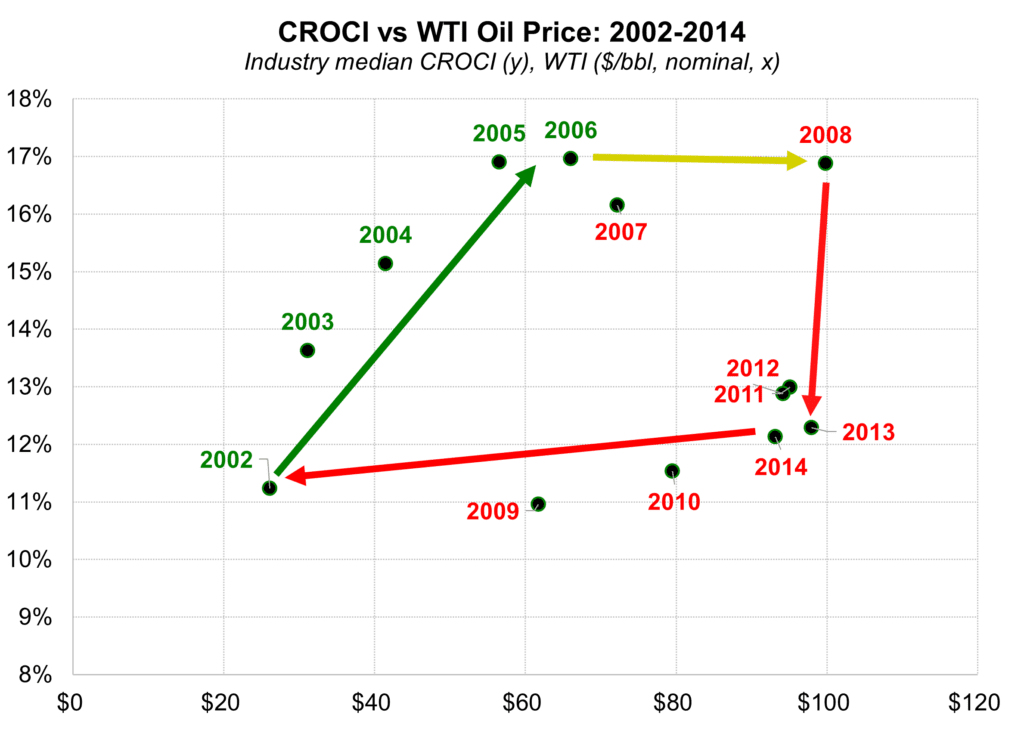
Source: FactSet, Veriten.
Exhibit 3: Quadrilateral of Death using ROCE
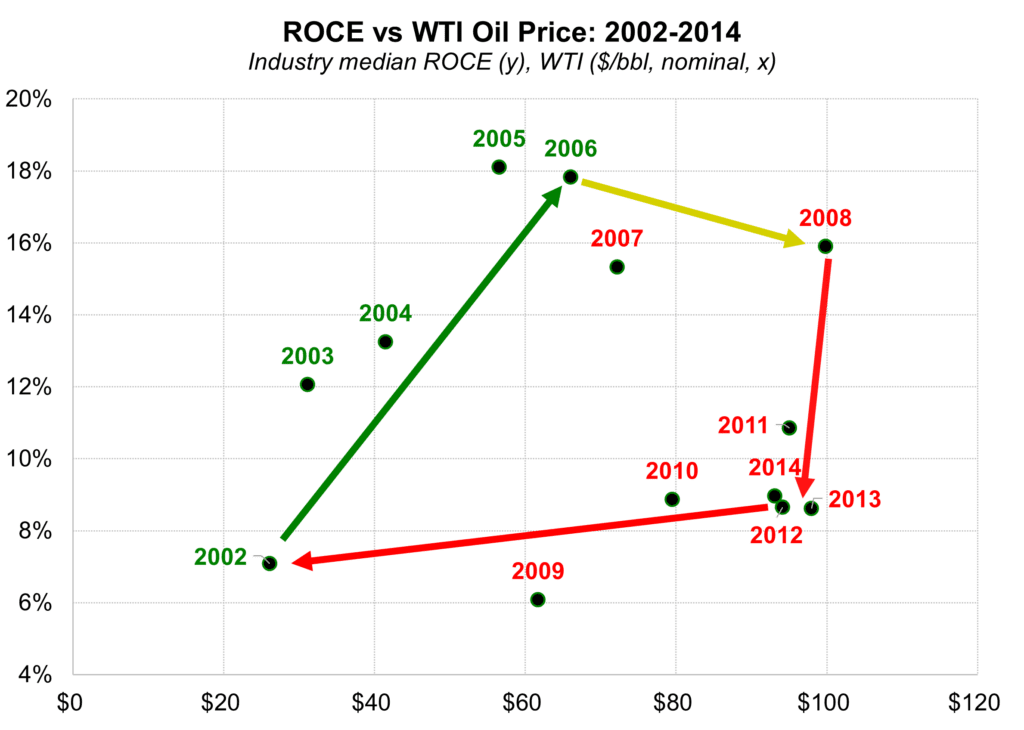
Source: FactSet, Veriten.
At the sub-sector level, the picture starts to vary
Exhibit 4 shows 2001-2023 average ROCE and CROCI for the various energy sub-sectors. A few observations:
- For every sector except the IOCs, historic average CROCI is higher than ROCE. The IOCs have long had the highest ROCE (though have now been passed by US downstream) and Exxon under Lee Raymond was the original champion of the ROCE metric.
- Oily vs Gassy E&Ps: Historic, long-term ROCE is weak for oily E&Ps and awful for gassy E&Ps. But CROCI is similar for both and also consistent with the IOCs. This observation deserves future follow-up as CROCI might mask shorter-lived assets for E&Ps versus IOCs. Clearly the write-offs have negatively impacted ROCE for both E&P sectors.
- Downstream companies stand out as generating leading ROCE and leading CROCI. This is now the profitability leadership group in traditional energy. It is confirming to see the strength on both metrics.
- Midstream companies have not historically had a lot by way of write-offs. We find it interesting that CROCI is only a bit below the other sectors, whereas the ROCE gap for midstream is wider. Midstream of course enjoys relatively more stable revenue/earnings/cash flow streams than the other energy sub-sectors. If CROCI is only slightly worse—and midstream is far less volatile and has decent growth options—it supports superior valuations for the sub-sector in general.
Exhibit 4: Historic ROCE and CROCI for energy sub-sectors
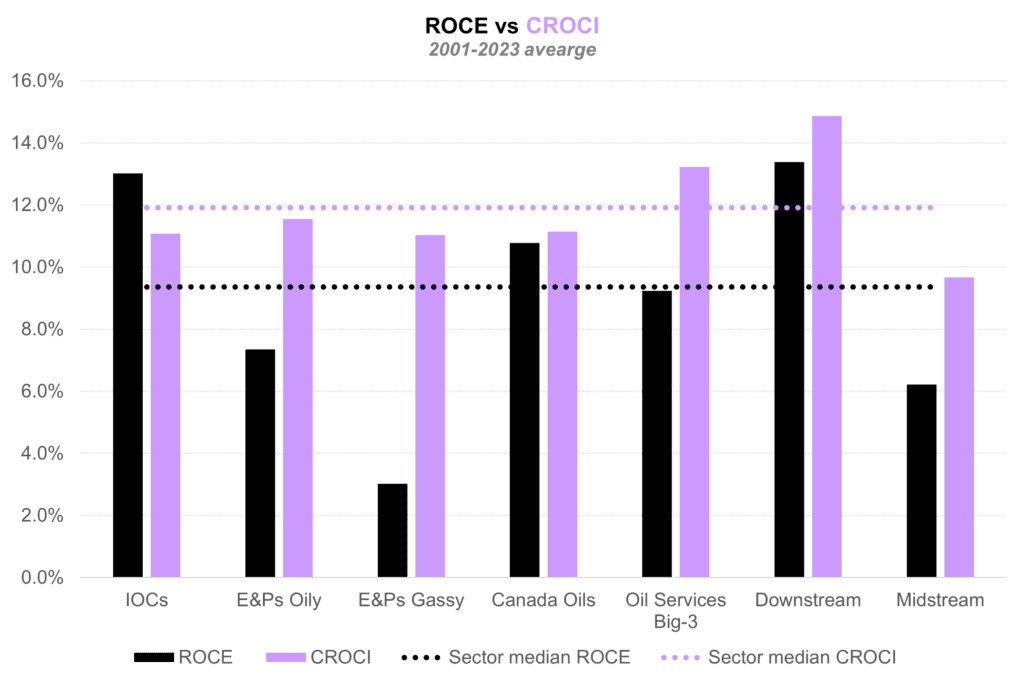
Source: FactSet, Veriten.
⚡️ On a Personal Note: Return mentors
I have long realized how lucky I am that I found a job—equity research analysis—that I have loved doing for 32 years now and counting. Its form has evolved from junior sell-side analyst (Petrie) to buy-side analyst (and de facto energy sector portfolio manager at JPMIM) to senior sell-side analyst (GS) to board and advisory work (COP, CGEP, ClearPath, Warburg Pincus) and most recently corporate advice, insights, and investing at Veriten. But with the sole exception of those last 1-2 years at Goldman when I was helping lead our Americas investment research division, it has never felt like work. The only job I didn’t like was the management one; I am a small government kind of guy—resist the bureaucrats!
A focus on full-cycle profitability has long underpinned my analytical framework, including evaluating areas like the crude oil or refining macro along with sector and company specific analysis as well as new technologies. If it doesn’t make money, it’s not going to last is the basic idea. I thought in this post I would recognize my profitability framework mentors that have had the biggest influence on how I have approached the energy sector and my career.
Forrest Hoglund, former CEO of Enron Oil & Gas (now EOG Resources). Petrie had me attend the great Enron (parent company) analyst events at Beaver Creek each year. At the time (early 1990s), Enron Oil & Gas was still majority owned by Enron Corp. I can still remember Mr. Hoglund’s presentation that emphasized ROCE specifically and the over-arching point that doing well on corporate-level returns was going to be important to an E&P company. It was my introduction to the topic.
Lee Raymond, former CEO of Exxon. I have highlighted Mr. Raymond many times in the past and he is the inspiration for our What Would Lee Raymond Do? post (here). One of my favorite Exxon memories was traveling to China while at JPMIM (it would have been with a group hosted by Jim Clark of CSFB or Doug Terreson of Morgan Stanley) and the group asking a senior executive why they weren’t investing in an upcoming natural gas project that was widely sought after by peers (paraphrasing): “Given the level of industry competition, I am not going to be the executive that overpays for this project who then has to go to Dallas and stand in front of Lee (Raymond) and explain why we have a single digit return and are possibly facing a write-down.” Exxon’s returns focus and investing in projects that were only going to be at the low end of the future cost curve permeated the organization globally.
Jim Clark, Gordon Hall, Chris Corapi. The trio of Jim and Gordon from CSFB and Chris Corapi, who recruited me to JPMIM to help him cover energy, were the ones that most helped me develop a framework for thinking about returns over a full-cycle, at various cyclical points in time, how and why companies or sectors improve or worsen on these metrics, and so much more. I have mentioned Jim and Gordon in a few notes now. Chris was a highly impactful buy-side mentor of mine, even though we only worked together for a relatively brief period. Honorable mention goes to the Bernstein sell-side team of John Mahedy and John Dowd. I have never been hard-core deep value in the classic Bernstein mold is the reason for honorable mention. Mahedy and Dowd were a great team and I loved spending time with them.
Steve Strongin. Some of you will remember Steve Strongin as Goldman’s first Commodities research analyst and the person that hired Jeff Currie to replace him (that was a good hire). Steve was never an equity research analyst and did not do company/sector research. What he brought was an analytical discipline that did not tolerate unquantified “narrative” explanations. Rather, he sought to quantify the narrative explanation within stock or sector valuations. Our first intense debate was my arguing that Exxon deserved its premium valuation in the late 1990s based on its superior ROCE. Steve empirically countered that Exxon’s premium returns accounted for a relatively small portion of Exxon’s premium valuation, with the remainder explained by it being among the “new Nifty 50” market cap behemoths of that era. If you are trying to make the correct investment call on Exxon, you have to properly analyze all the possible drivers, not simply that ones you might be best equipped to understand as a sector specialist. The ability to calmly take very different viewpoints from the consensus narrative is what I take most from having Steve first as a mentor and ultimately my boss. He is the person that encouraged me to become co-Director of Americas Research, the job that drove me to early retirement. Of course, I would have never seen my children if I hadn’t taken that job, so all’s well that ends well.